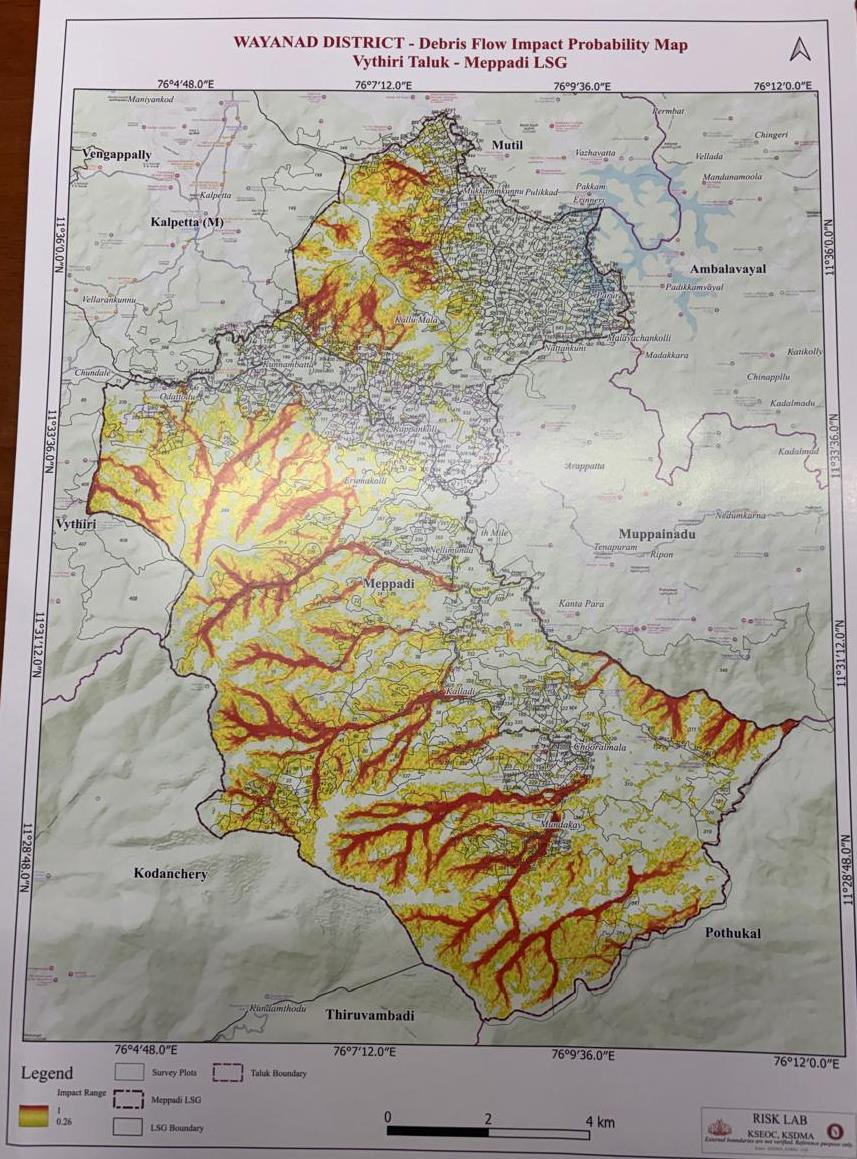

Debris flow impact potential map
This is a map that specifies which areas are likely to be affected, and to what extent, in the event of a landslide or debris flow (a torrent of heavy soil, rock, and water). In simple terms, it is a map prepared by pre-calculating the probability of landslide debris falling and causing damage in a particular area.
Risk Levels (Levels of Impact Probability)
Different colors are used on the map to indicate the risk level of each area:
Different colors are used on the map to indicate the risk level of each area:
- Red (High Probability): Areas with the highest likelihood of being directly hit by landslide debris. The damage here will be severe.
- Yellow / Orange (Medium Probability): Zones with moderate risk.
- Green / Blue (Low Probability): Areas with very low risk or places that are relatively safe.
Flow Path & Runout Zone
- Flow Channels: The routes through which soil and rocks are likely to slide down from the hilltop are marked on this map.
- Deposition Area: This map also helps in understanding where the debris flow is likely to come to a halt.
Factors Used to Prepare the Map
Experts analyze several factors to create this map:
Experts analyze several factors to create this map:
- Topography: The steepness of the hillsides (Slope Angle).
- Rainfall Data: The history of heavy rainfall likely to occur in that area.
- Soil and Rock Structure: Whether the soil type is highly prone to erosion or easy collapse.
Benefits of This Map
- Identifying Safe Locations: Helps determine the best locations for relief camps to evacuate and shelter people in the event of a disaster.
- Regulating Construction Activities: Assists in avoiding the construction of houses, roads, or other infrastructure in high-risk zones.
- Taking Precautionary Measures: Plays a major role in helping authorities and local communities prepare effective disaster management plans.